University of Alaska Fairbanks
  |  Alaska Climate Adaptation Science Center

About

We’ve made climate model projections for Alaska and western Canada easier to understand

What’s in a Northern Climate Report?

See stories and graphics that show how your part of the North may change over time. Use these to better understand and reduce risk, plan infrastructure, manage natural resources, and communicate change. You can also download data.

How is this region changing?

Temperatures are rising. Earlier springs, warmer summers, later autumns, and less severe winters are changing the mix of species on the Northern landscape.

Permafrost is thawing. This alters surface drainage and increases possible rooting depths, yielding ecological shifts.

Wildfires are more frequent. More early-succession and fewer late-succession vegetation species appear across landscapes.

Best practices for using climate projections

Think broadly. Climate projections are most reliable when averaged across time or space because daily variations are “smoothed out.” Examples: “projected average of 30 years of winter precipitation for Bethel, Alaska” or “projected hottest temperature for the north coast of Alaska.”

What seems most likely? The climate we will experience will not look exactly like any one projection, but it will look like a lot of them. So, plan for the likely range of climates, impacts, and risks for the time frame and region you’re working with.

Don’t wait! Projections are always improving, but don’t wait for a better one—you’ll always be waiting, and the costs of waiting will increase. Instead, plan for the range of historical variability plus the range of climates described by a moderate or higher warming model under a high emissions scenario.

Best practices, illustrated

These models provide a range that brackets average outputs across all CMIP5 models, and also perform well in Northern regions.

  • Use multiple decades and historical comparisons. Longer-term averages resist model variability and natural variations. Compare a future (like 2070–2099) to a historical reference (like 1981–2010)—the later the reference, the more climate change is already a part of it!
  • Summarize data over a region. Larger areas, such as watersheds or planning units, are less affected by local variations in elevation, vegetation, etc. than small areas.
  • Use multiple emissions scenarios. Humans are unpredictable, so pick at least two scenarios that bracket the likely range, unless you only want the “higher risk” or “lower risk” case. RCP 4.5 and RCP 8.5 are good choices.
  • Use multiple models and/or an average. All models are plausible, if not equally likely. Use several models if the full range of possibilities is important to your work. Use a model average if you’re more interested in the most likely outputs.
  • Include medium-term and longer-term futures. A comprehensive assessment would consider a historical, a mid-21st century future, and a late-21st century future. The two futures should each have a high, low, and middle range, with multiple models and multiple emission scenarios in each future window.

Glossary

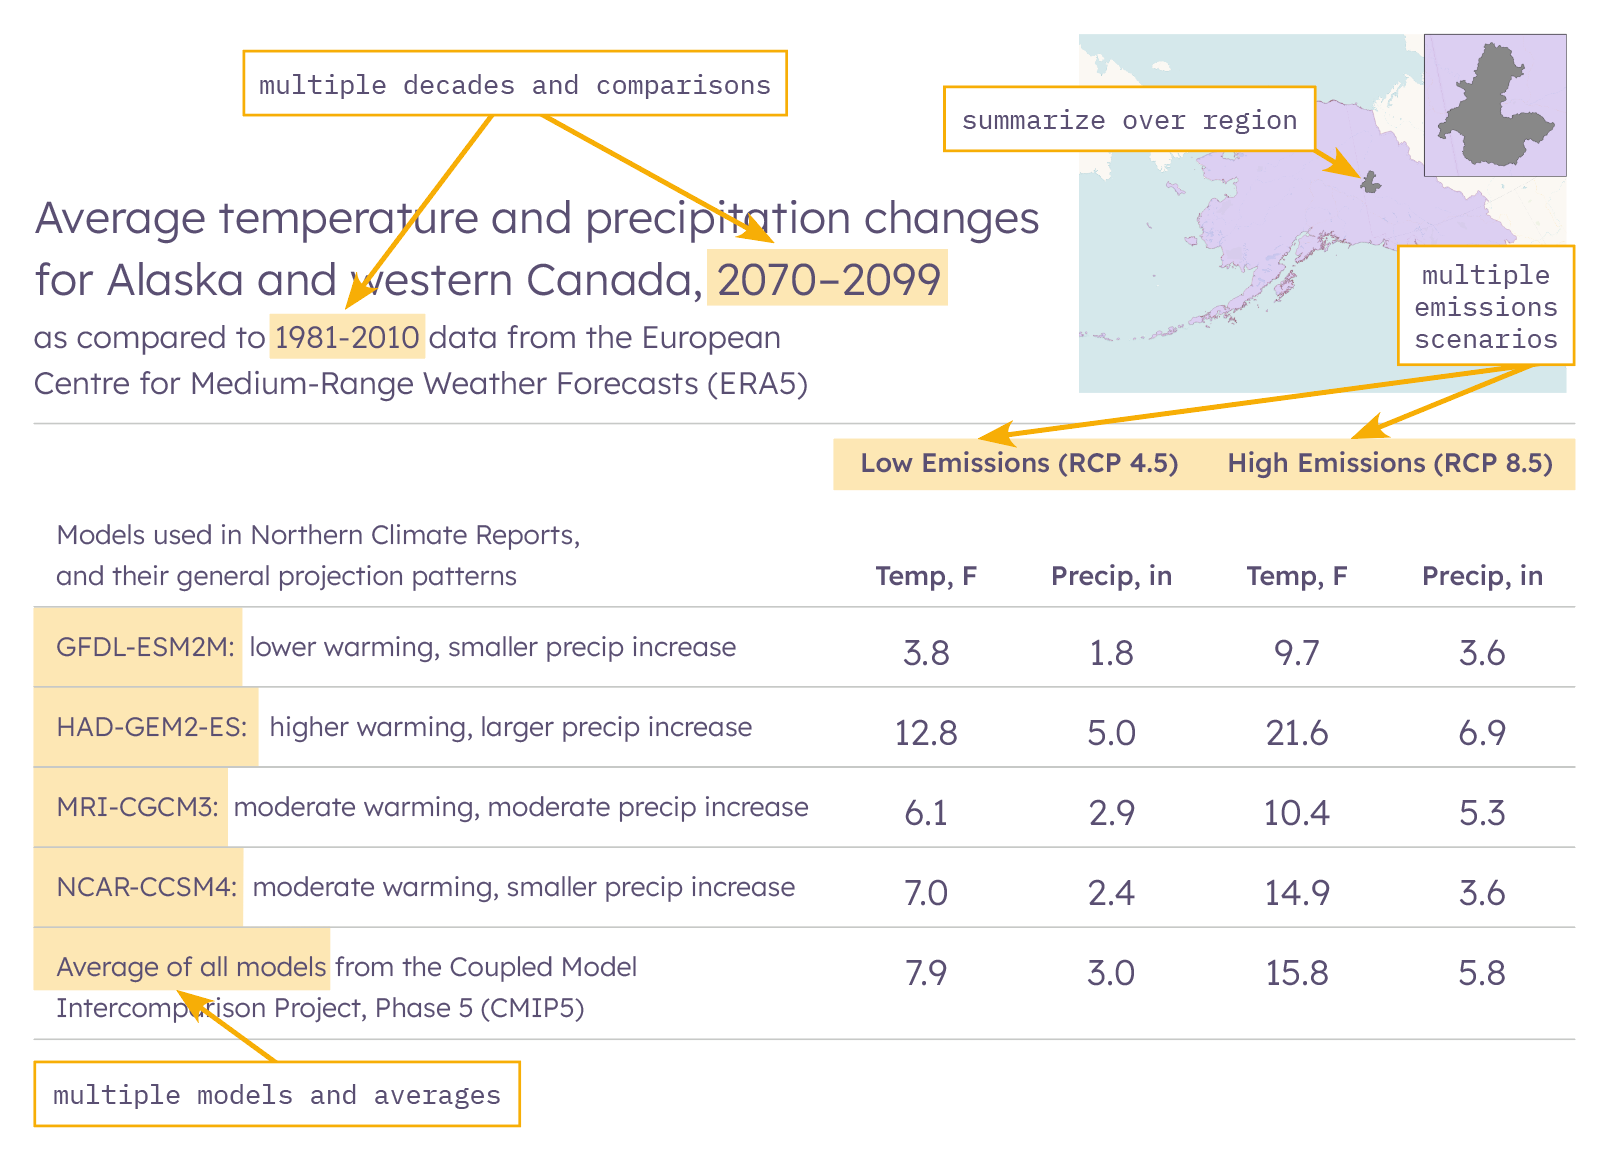
GFDL ESM2M — Developed by the NOAA Geophysical Fluid Dynamics Laboratory (GFDL), this Earth System Model version 2M (ESM2M) models the movement of carbon through the earth system. Learn more about this model

HadGEM2-ES — Developed by the UK Met Office Hadley Centre (Had), this Global Environment Model version 2 (GEM2) incorporates Earth Systems (ES) including atmospheric land and ocean carbon cycles, dynamic vegetation, ocean biology, and atmospheric chemistry. Learn more about this model

MRI CGCM3 — Developed by Japan’s Meteorological Research Institute (MRI), this Coupled Global Climate Model version 3 (CGCM3) includes models for atmosphere-land, aerosols, and ocean-ice. Learn more about this model

NCAR CCSM4 — Developed by the National Center for Atmospheric Research (NCAR), the Climate System Model version 4 (CCSM4) is composed of four separate models simultaneously simulating Earth's atmosphere, ocean, land surface and sea ice. Learn more about this model

Northern Climate Reports employs these (and more) models, all of which perform well in the North, so that data users can think broadly about the range of possible futures. See this paper, which describes the models, model selection process, and downscaling of model output.

Representative Concentration Pathways (RCPs) have been developed for the climate modeling community as a basis for modeling experiments. RCPs portray possible future greenhouse gas and aerosol emissions scenarios. RCP scenarios are not specific policies, demographics, or economic futures; instead, they are defined by total solar radiative forcing (atmospheric energy changes caused by greenhouse gas emissions, measured in watts per square meter) by 2100.

  • RCP 4.5: the concentration of atmospheric carbon that warms Earth at an average of 4.5 watts/m2. In this scenario, emissions peak around 2040 and then decline.
  • RCP 8.5: the concentration of atmospheric carbon that warms Earth at an average of 8.5 watts/m2. In this scenario, emissions continue to rise throughout the 21st century. Climate change projected under RCP 8.5 will typically be more acute than under RCP 4.5.

RCP 4.5 and RCP 8.5 are displayed in Northern Climate Reports, allowing users to assess emissions-dependent variability and evaluate a moderate scenario alongside a more extreme scenario. Learn more about RCPs